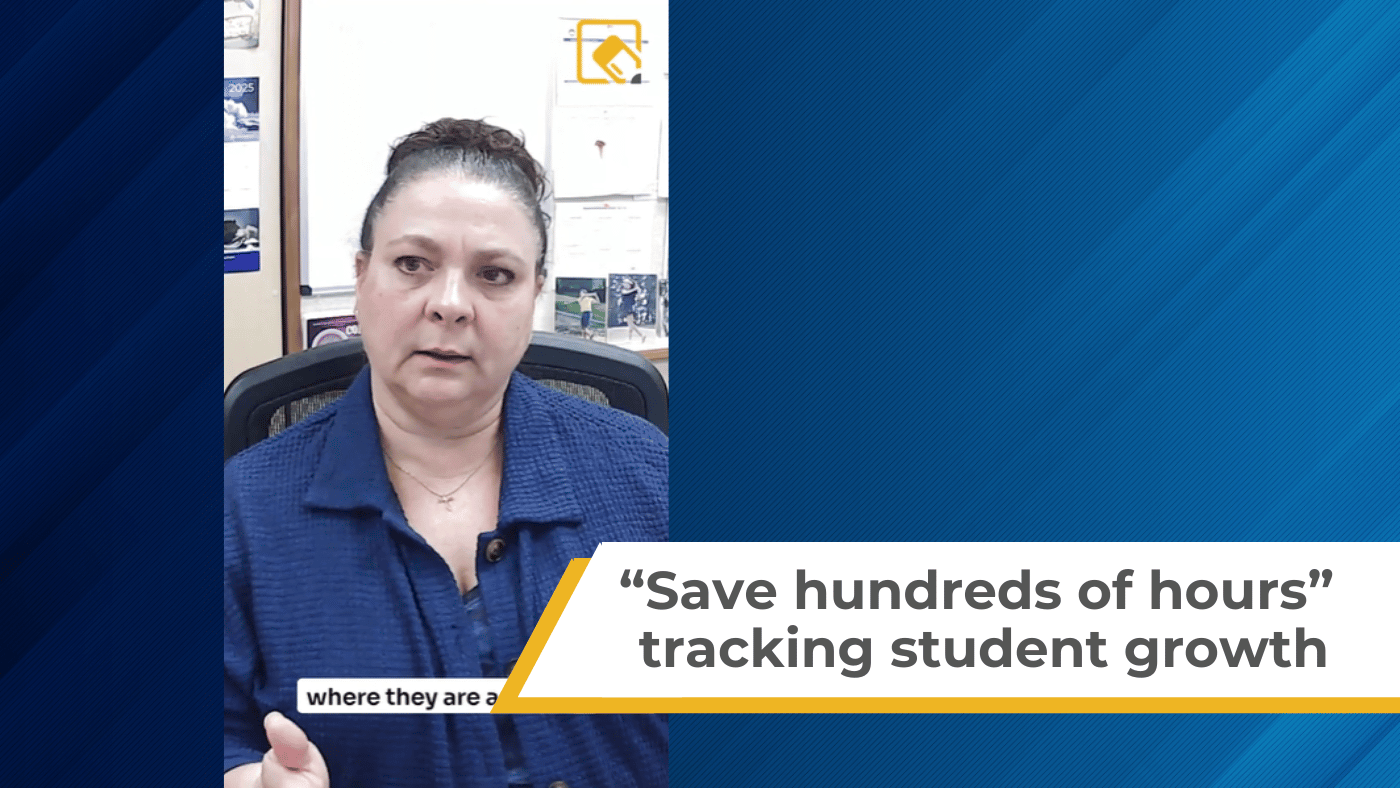
Evelyn Modahl, who manages Assessment and Technology Integration for Arlington Schools in Washington, describes how Homeroom saves her district hundreds of hours a year in comparative analytics. Student growth charts and other tools allow for easy understanding of multiple datasets, efficiently painting a clear picture of student needs and progress.
Insights
Case studies and best practices for
districts’ data-informed decisions.
"You can do anything with your data"
Listen to article
Audio generated by DropInBlog's Blog Voice AI™ may have slight pronunciation nuances. Learn more