EPIC Analytics: Informing decisions
with Efficiencies, Performance
Insights, and Comparability
GET STARTED Maximize Every Dollar
and Desk
EPIC Analytics turns fragmented info into
a shared roadmap for Finance, HR, and
Academic leaders.
By replacing silos with visual insights, we help
your cabinet move from reactive budgeting to
proactive strategy, ensuring every investment
intentionally drives student success through
district performance analytics.

Explore the benefits
-
Proactive
Fiscal Forecasting
Take control of your district’s future with dynamic “what-if” scenario planning. Predict long-term outcomes based on shifting enrollment or tax revenue to mitigate fiscal risk and protect your fund balance before it impacts the classroom.

-
Strategic
Personnel Planning
Align your staffing levels with current and future needs using precise enrollment projections and student retention patterns. Use current pupil-to-staff ratios to drive data-informed contract negotiations and ensure equitable teacher distribution.

-
Intelligent Peer Benchmarking
Use intelligent comparison tools to benchmark against custom peer groups, providing the objective evidence needed to justify resource allocation and student outcomes to your board.

-
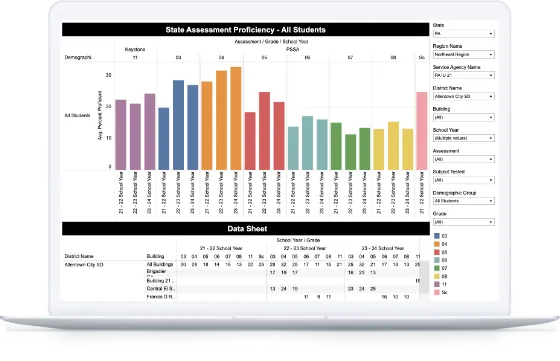
Transparent Performance Insights
Build community trust with a single source of truth. Transform complex financial records into visual dashboards and clear, shareable reports that tell your district’s story to the board and the public.

Feature Highlights
-
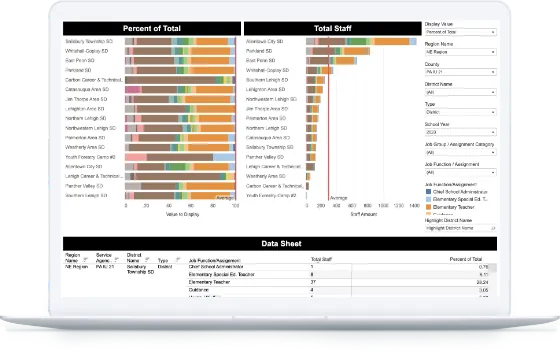
Customizable Peer Comparison
Find the most similar districts and see how
you stack up in real-time. Explore, test,
and re-test various groups to make
confident, data-backed choices. -
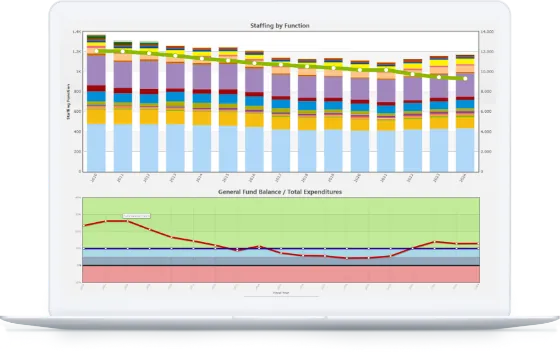
Precision Staffing & Retention
Model the impact of student retention patterns
and grade-level progression on future staffing needs.
Use precise enrollment projections to secure the
right personnel and maintain optimal
pupil-to-staff ratios. -
Shareable Reports & Embedded Charts
Build custom reports and embed easy-to-read
charts directly onto your website. Combine financial
data and narrative to keep stakeholders
informed automatically. -
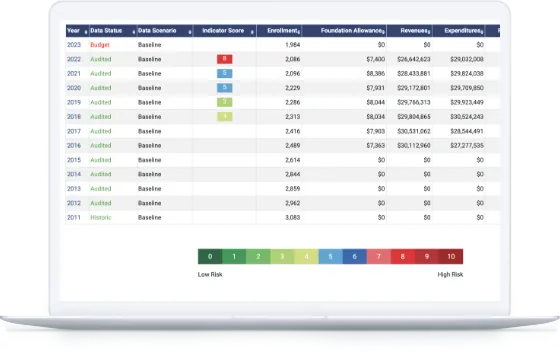
Fiscal Wellness Indicators
Quickly understand your district’s health
with a simple, color-coded score. Spot trends,
flag risks, and track progress year-over-year
without opening a spreadsheet.

Driving Equitable Outcomes
Don’t just balance the books, bridge the achievement gap. By integrating demographic, attendance, staffing, and community financial data, you can target resources to underserved groups and turn fiscal planning into a powerful engine for student success.